 Рабочее место участника
| Выбрать соревнование | Задачи | Послать решение | Результаты проверки | Статистика по задачам | Вопросы и ответы | Результаты соревнования | Состояние сервера | Изменить данные | Управление командой | Помощь |
 Задачи
690. Slim Span Олимпиадные задачи на английском языке
| 19/11/2007 | Тренировка (задачи ACM ICPC Asia RC Tokyo 2007) (F) |
Ограничения: время – 5s/10s, память – 64MiB Ввод: input.txt или стандартный ввод Вывод: output.txt или стандартный вывод 
Послать решение Blockly Посылки Темы Где Обсудить (0)
Given an undirected weighted graph `G`, you should find one of spanning trees specified as follows.
The graph G is an ordered pair `(V,E)`, where `V` is a set of vertices `{v_1,\ v_2,\ …,\ v_n}` and `E` is a
set of undirected edges `{e_1,\ e_2,\ …,\ e_m}`. Each edge `e\ ∈\ E` has its weight `w(e)`.
A spanning tree `T` is a tree (a connected subgraph without cycles) which connects all the `n`
vertices with `n\ -\ 1` edges. The slimness of a spanning tree `T` is defined as the difference between
the largest weight and the smallest weight among the `n\ -\ 1` edges of `T`.

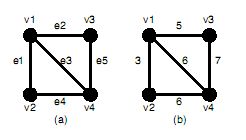
Figure 1: A graph G and the weights of the edges
For example, a graph `G` in Figure 1(a) has four vertices `{v_1,\ v_2,\ v_3,\ v_4}` and five undirected edges
`{e_1,\ e_2,\ e_3,\ e_4,\ e_5}`. The weights of the edges are `w(e_1)\ =\ 3`, `w(e_2)\ =\ 5`, `w(e_3)\ =\ 6`, `w(e_4)\ =\ 6`,
`w(e_5)\ =\ 7` as shown in Figure 1(b).

Figure 2: Examples of the spanning trees of G
There are several spanning trees for `G`. Four of them are depicted in Figure 2(a)?(d). The
spanning tree `T_a` in Figure 2(a) has three edges whose weights are 3, 6 and 7. The largest weight
is 7 and the smallest weight is 3 so that the slimness of the tree `T_a` is 4. The slimnesses of
spanning trees `T_b`, `T_c` and `T_d` shown in Figure 2(b), (c) and (d) are 3, 2 and 1, respectively. You
can easily see the slimness of any other spanning tree is greater than or equal to 1, thus the
spanning tree Td in Figure 2(d) is one of the slimmest spanning trees whose slimness is 1.
Your job is to write a program that computes the smallest slimness.
Input
The input consists of multiple datasets, followed by a line containing two zeros separated by a
space. Each dataset has the following format.
`n\ \ \ m`
`a_1\ b_1\ w_1`
`***`
`a_m\ b_m\ w_m`
Every input item in a dataset is a non-negative integer. Items in a line are separated by a space.
`n` is the number of the vertices and `m` the number of the edges. You can assume `2\ ≤\ n\ ≤\ 100`
and `0\ ≤\ m\ ≤\ n(n\ -\ 1)/2`. `a_k` and `b_k` `(k\ =\ 1,\ …,\ m)` are positive integers less than or equal to
`n`, which represent the two vertices `v_{a_k}` and `v_{b_k}` connected by the `k`th edge `e_k`. `w_k` is a positive
integer less than or equal to 10000, which indicates the weight of `e_k`. You can assume that the
graph `G\ =\ (V,E)` is simple, that is, there are no self-loops (that connect the same vertex) nor
parallel edges (that are two or more edges whose both ends are the same two vertices).
Output
For each dataset, if the graph has spanning trees, the smallest slimness among them should be
printed. Otherwise, `-1` should be printed. An output should not contain extra characters.
Sample Input
4 5
1 2 3
1 3 5
1 4 6
2 4 6
3 4 7
4 6
1 2 10
1 3 100
1 4 90
2 3 20
2 4 80
3 4 40
2 1
1 2 1
3 0
3 1
1 2 1
3 3
1 2 2
2 3 5
1 3 6
5 10
1 2 110
1 3 120
1 4 130
1 5 120
2 3 110
2 4 120
2 5 130
3 4 120
3 5 110
4 5 120
5 10
1 2 9384
1 3 887
1 4 2778
1 5 6916
2 3 7794
2 4 8336
2 5 5387
3 4 493
3 5 6650
4 5 1422
5 8
1 2 1
2 3 100
3 4 100
4 5 100
1 5 50
2 5 50
3 5 50
4 1 150
0 0
Output for the Sample Input
1
20
0
-1
-1
1
0
1686
50
 Начало